
Objective color and quality control, anywhere, any time.
The VideometerLite+ is Videometer’s portable instrument for multispectral image acquisition. It captures reflectance across 15 wavelengths from visible to short-wave infrared, imaging color and appearance across the entire sample rather than a single point.
Paired with Videometer’s machine-learning software, it turns those measurements into objective, documented pass/fail decisions for routine quality control and screening across food, pharma and materials. An integrating sphere and one-click calibration deliver reproducible, operator-independent results, in the field, on the line, or in the lab.
Backed by 25+ years of R&D and 500+ peer-reviewed papers.
Subscription-based.

MEASUREMENT EXAMPLES
Measuring color as it really is
Real color measurements from the VideometerLite+ workflow.
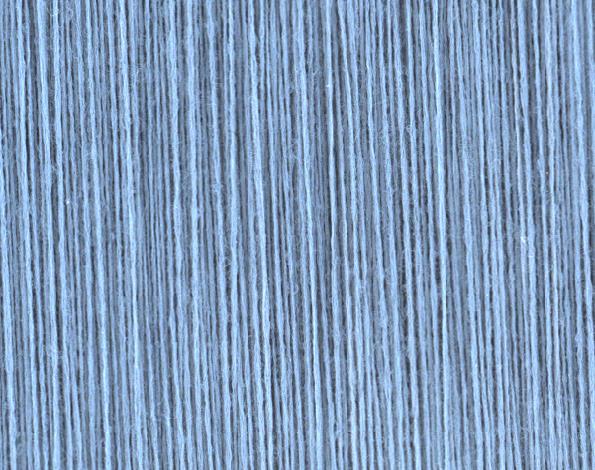
Yarn color, measured on the yarn, not the weave
On a woven fabric the yarn sits on raised ridges with shadowed valleys between the threads. A single averaged reading blends ridges, valleys and shadows together, so the number drifts with weave and construction rather than the dye. VideometerLite+ classifies the ridge pixels where the true yarn surface shows and measures color there.
Ridge-weighted
R² 99.3%
color strength (L*) vs dye dose
Conventional avg
R² 87.3%
same trial, averaged reading
Strawberry powder color, region by region
A tub of strawberry powder looks like one pink color, but it is a mix of redder clumps and lighter grains. A single average hides that spread. VideometerLite+ resolves color across the whole sample and reports L*a*b* for each region independently, so batch-to-batch shade and uniformity are quantified, not eyeballed.
Redder clumps
a* 40.6
L* 40.0 · b* 5.6
Lighter grains
a* 36.6
L* 48.3 · b* 6.8
 Redder clumps
 Lighter grains
 RGB
RGB
 Spectral (band 5)
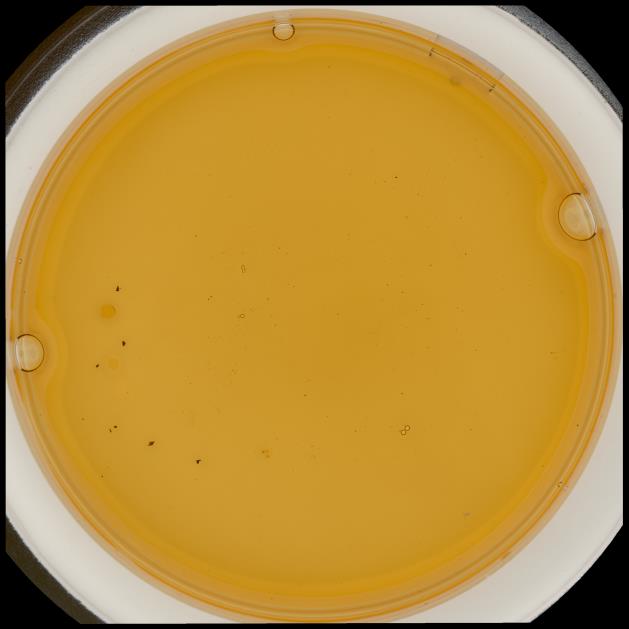
Tea varieties that look identical, told apart
Two brewed tea varieties look almost the same in the cup. Their spectral reflectance does not. Across 15 bands the varieties separate cleanly, with the largest gap in the green to amber region, so a simple threshold on those bands sorts one variety from the other, and a spectral transformation renders each as its own color.
Variety CH
15.4%
mean reflectance, band 5
Variety P
18.3%
mean reflectance, band 5
Download and learn more about measuring color with the VideometerLite+
DownloadKEY FEATURES
Spectral imaging from field to lab
Spectral imaging and machine learning in a compact, portable instrument.
15
bands from VIS to NIR
500+
peer-reviewed papers behind the technology
25+
years of applied spectral imaging
Get in Touch!
Get in touch with one of our experts to learn more about the VideometerLite+ and its multiple and versatile functionalities that can be used anywhere, anytime.